OUR PROJECT VIDEO
CLASS LECTURES
Folder contents:
-
Details
Chapter 1 Introduction and Data Analysis.pdf
Chapter 1 Introduction and Data Analysis.pdf
-
Details
Chapter1-Homework.pdf
Chapter1-Homework.pdf
-
Details
Chapter 2 Data Description.pdf
Chapter 2 Data Description.pdf
-
Details
Chapter 3 Descriptive Statistics.pdf
Chapter 3 Descriptive Statistics.pdf
-
Details
Chapter 4 Probability, Random Variables and Probability Distributions.pdf
Chapter 4 Probability, Random Variables and Probability Distributions.pdf
-
Details
Course Information SECI-SCSI 2143 PROBABILITY & STATISTICAL DATA ANALYSIS.pdf
Course Information SECI-SCSI 2143 PROBABILITY & STATISTICAL DATA ANALYSIS.pdf
-
Details
R-Programming.pdf
R-Programming.pdf
ASSIGNMENTS
Folder contents:
-
Details
Assigment 1 - 201920 sem 2 - QUESTION.pdf
Assigment 1 - 201920 sem 2 - QUESTION.pdf
-
Details
Assignment 2 - 201920 sem 2 - QUESTION.pdf
Assignment 2 - 201920 sem 2 - QUESTION.pdf
-
Details
Assignment 3.Option_1.pdf
Assignment 3.Option_1.pdf
-
Details
Assignment 3.Option_2.pdf
Assignment 3.Option_2.pdf
WHAT I HAVE LEARNT
I want to discuss some very fundamental terms/concepts related to probability and statistics that often come across any literature related to Machine Learning and AI.
Random Experiment
A random experiment is a physical situation whose outcome cannot be predicted until it is observed.
Sample Space
A sample space, is a set of all possible outcomes of a random experiment.

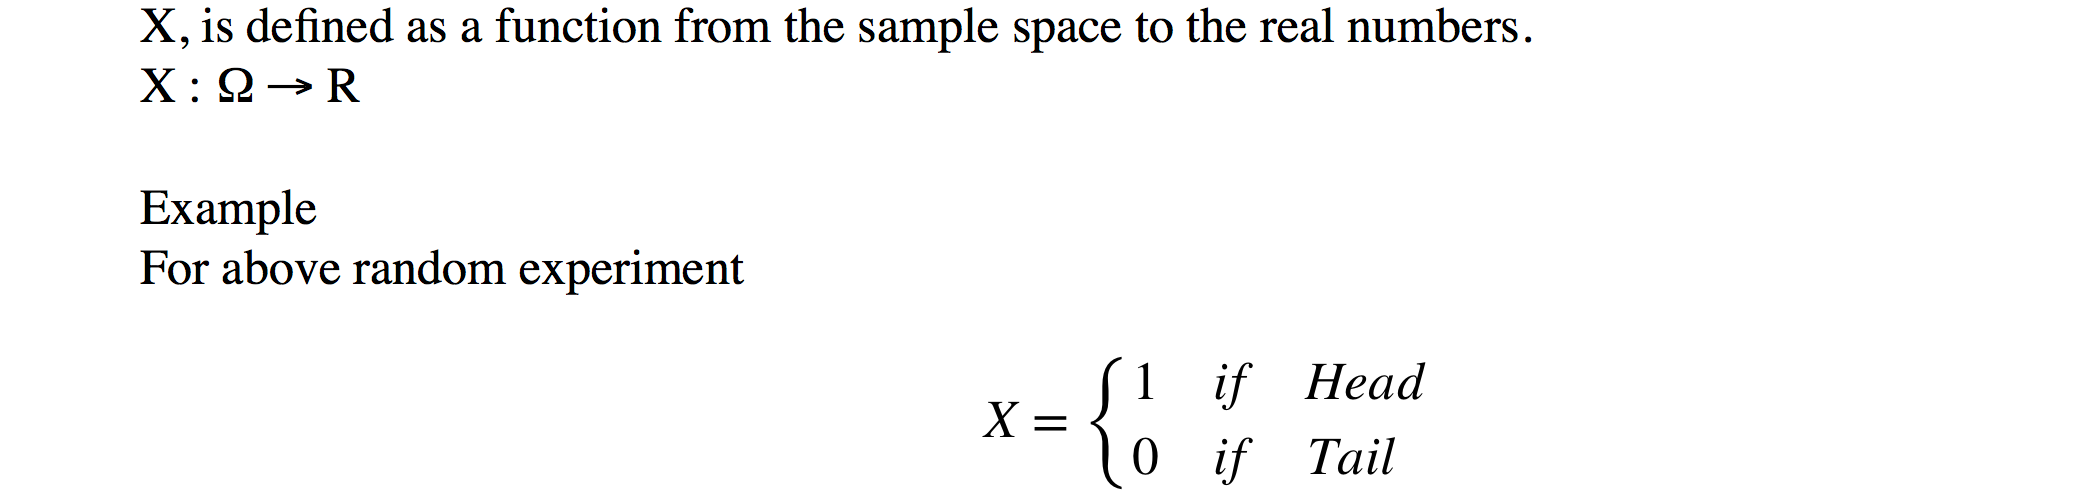
Random Variables
A random variable, is a variable whose possible values are numerical outcomes of a random experiment. There are two types of random variables.
1. Discrete Random Variable is one which may take on only a countable number of distinct values such as 0,1,2,3,4,…….. Discrete random variables are usually (but not necessarily) counts.
2. Continuous Random Variable is one which takes an infinite number of possible values. Continuous random variables are usually measurements.
Probability
Probability is the measure of the likelihood that an event will occur in a Random Experiment. Probability is quantified as a number between 0 and 1, where, loosely speaking, 0 indicates impossibility and 1 indicates certainty. The higher the probability of an event, the more likely it is that the event will occur.
IMPORTANCE OF STATISTICS
PSDA SURVEY REPORT
PROJECT REFLECTION
An efficient transportation system has a significant impact on the quality of life, opportunity for recreation, education, social and business. Passengers have varying competing means of transportation. The most used means of transportation apart from walking is by public transport, which includes taxi such as Grab, Maxim and others. The research is about collecting information from all the relevant sources to find answers to the research problem, test the hypothesis and evaluate the outcomes through interviews & questionnaire. UTM Faculty Computing students on frequent usage of shuttle bus by UTM students do this project. This is a survey mainly focused on the students of Undergraduate, Postgraduate and PhD. We asked students and made comparison. From our data we get to see that the transport students usually use is shuttle bus, we created a virtual spreadsheet providing the questionnaires and tried to reach as many students as possible.
In choosing the best method of user requirement elicitation, several factors were taken into consideration firstly; the quantity of data to be collected is taken into account. Additionally, time constraint of the project mean that the study will need to be conducted and concluded in a short amount of time. With these two factors taken into account, time consuming and more directed requirement methods such as questionnaires and interviews. This study is conducted using a survey, which satisfies the aforementioned factors and allows for a large quantity of data to be collected in a short amount of time. In order to ensure that responses collected are from the correct respondents (i.e. students), the survey is decided to be passed out online by using google form and distributed by social platform. There are 107 respondents have participated in this survey.
Furthermore, since the outbreak of COVID-19 not many students were interested and with that in mind, we decided that survey questions should be easy to answer and be in small quantity. We are using a various statistical measures.
- Population and Sample
- Data Collection Procedure
- Data Representation Procedure
- R Programming
One way to achieve this is to ask questions that are more directed and allow respondents to easily give an answer, such as Yes/No questions. The questionnaire was constructed to examine a number of substantive areas and to acquire foundation information, such as demographics and transit performance information. The study included the following areas of inquiry.
The University Transportation Survey is one of a few attempts to document and understand transportation on and around university campuses. The results of the survey can best be used in the day-to-day setting where a university, a transit agency, a student government, or others are comparing their own circumstance to those found around the University. Majority of the respondents for the study use the campus shuttle every other day because of the lower transport fares for mainly educational reasons. Different methods were used to test our hypotheses for the study. The students indicated that campus shuttle bus service is of poor quality. The results portray that student are not fully satisfied with the services. On this not, transport section should look at the attributes of assurance, tangibility, empathy and receptively to improve perception of service quality. This will help them to maintain and satisfied students will make positive recommendation to other students.
Improving public transport service quality is an effective way to enhance bus attractiveness, this research constructed a satisfaction evaluation. By analysing the different segment’s satisfaction evaluation and influencing factors of satisfaction, the study found that the bus type and arrival time is the primary factor that affects the overall satisfaction.
This study has not, for example, determined the “best” or most productive shuttle service for travel around a central campus. This effort is beyond the scope of this project. However, as the body of data and information increase related to university transit systems, one of the first efforts should be a closer examination of these specific types of service. Determining the characteristics that enhance productivity by service type would provide extremely useful information for university related transit systems across the University Technology Malaysia.
Generally, universities take their campus master planning quite seriously. Most do an excellent job of planning for the future of their campuses. However, university communities could enhance the future of their communities by: Completing a master transportation plan for the community that includes transportation facilities, transit service and facilities, bicycle and pedestrian networks, and access and mobility for its citizens, and Working more closely with their university counterparts in all aspects of planning.
In a quote worth repeating from James H. Miller in his work titled “Transportation on College and University Campuses:”
“Greater efforts need to be made to share information on successes, failures, and lessons learned. … efforts and programs should be developed to facilitate the sharing of information between university communities, and also to translate the knowledge gained to applications for all communities.’’