Chapter 3 - Basic Application Software
by AIN AFIQAH
DEFINITION AND DIFFERENTIATION BETWEEN GENERAL AND SPECIFIC SOFTWARE
There are two different type of software that are basic application software and specialized application software. Basic application is widely used by all type of people from organization to personal matters however specific or specialized application are used in specified occupation and purposes such as editing movie and sound even creating programs. In older version of basic application software, the common features that a must have are graphical user interface, menus, windows, icons, toolbars and dialog boxes. But in the latest version of Microsoft Office have a few features that one of them are called as ribbons that replaced toolbars and menus, then they have galleries that have the function of providing alternatives that users can select to match with their tasks and tabs that participate in the next performance by appearing automatically on the screen. Some of the basic application software are word processor, spreadsheets, database management systems and presentation graphics.
WORD PROCESSOR
Word processors is a software that create text-based documents such as letters, manuals, brochures, pages, reports and many more. Therefore, word processors are one of the common applications that every microprocessor must have whether it is Microsoft Word, Apple Pages, Corel WordPerfect, Open Office or even Google Docs. In the process of making a document, there will be a few features that are used in editing and formatting documents. Some of the compulsory features that word processors must have are:
|
No. |
Features |
Explanation |
|
1. |
Word wrap |
Automatically transfer the new insertion point into the new line whenever the current line is full. |
|
2. |
Find and replace |
Software will locate the selected words and replace it with other words that the users desire. |
|
3. |
Thesaurus |
Provide replacement for the selected word or phrases includes synonym, antonym, and related words. |
|
4. |
Spelling and grammar checker |
Look for misspelled and other word structure problems and replace it with the correct ones. |
|
5. |
Font |
Give many types of character design that can be chosen based on the tasks. Example Arial and times new roman. |
|
6. |
Size |
Users are able to adjust the height of characters depends on the format. |
|
7. |
Effects |
The appearance of characters can be enhanced by using effects such as bold, italic, colors, underline and strikethrough. |
|
8. |
Lists |
Bullet and numbered lists are provided to help make the sequence of topics easy to read. |
However, for the latest version of word processors especially for Microsoft Window, there are few new features that have been updated. The first one is the users can leave comments on the documents. This is suitable for the lecturers and teachers to check and comments the work of their students. Next is users can customize their own ribbons and archive toolbars that they do not use.
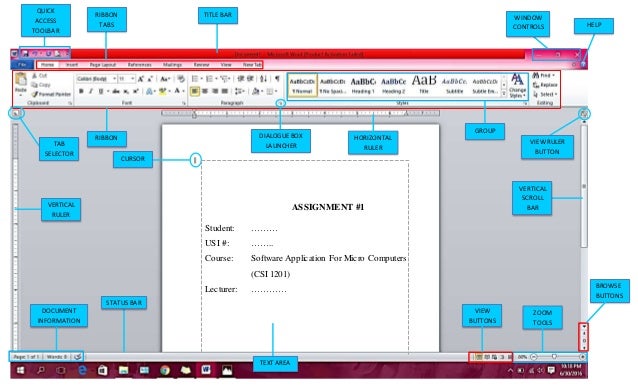
Figure 1 - Microsoft Office
SPREADSHEETS
Spreadsheets is one of the basic applications that commonly used whenever involve numbers and mathematical operation especially in organize data, analyze and numeric graph such as budgets and financial reports. Spreadsheets are widely used by every profession even the students can use the program to calculate their grade point average. Some of the example of spreadsheet programs are Microsoft Excel, Apple iWork’s Numbers and Corel Quattro Pro. As I mention earlier, spreadsheet manipulate numeric data and use it to create workbook files. So, workbook file is consisting of one or more worksheet that contain of rectangular grid of rows and columns with labels of digits and letters respectively. As the users read spreadsheets, the intersection of row and column is called as cell. For example, cell G20 is consists of column G and row 20.
In spreadsheet program, a numeric entry can be either number or formula. Formula usually used when it involves mathematics process such as addition, subtraction, multiplication, division and other complex functions. Speaking of function, spreadsheet have provided many kinds of formula that applicable for the work. If users enter a function of SUM(F5:F10), the program will do the calculation by adding the values range from D5 to D10. Range is a series of continuous cells involved. Next is the tools that available in spreadsheet. One of the convenient tools that spreadsheet have is analytical graphs and charts that can be visualized from the data in the programs. With that it will be easier for other people to understand the topic rather than reading all the numbers. Other than the visual representation of data, spreadsheet also have what-if analysis that helps the users to see the outcome of changing certain values of data especially in business field as the program will undergo recalculation of the new data automatically. The advantage of this tool is that the users or the company can come out with strategies that could help them to overcome their problems. This is because they are able to analyze the data carefully.
:max_bytes(150000):strip_icc()/dos-donts-data-entry-excel-1-56a8f8633df78cf772a255c6.jpg)
Figure 2 - Microsoft Excel
PRESENTATION GRAPHIC
Graphic presentation is widely used all over the world by every age of people weather they are from companies to shops to students. Presentation graphics are programs that combine variety of visual objects to create interesting presentation. Three of the most used presentation graphic programs are Microsoft PowerPoint, Corel Presentation and Apple Keynote. There are a few illustrations that can be put inside presentation graphics. Now, let’s look at the features that presentation graphics have to offer.
In electronic presentation, there are series of pages a.k.a slides that is used to put all the contents in the presentation. Users are free to create attractive slides by applying design templates and content templates that provide selections of color schemes, page layouts, and special effects. Throughout the making of presentation slides, users can use other tools to enhance their contents such as points, pictures, statistics, tables, videos and many more. At the end to the process, users can edit their presentation by using transitions, animations and even can set up the slides in terms of duration for each slide. Other features that available are leaving comment on the slides, share the presentations online and prints the slides according to the options provided.
Figure 3 - Microsoft PowerPoint
SOURCE
- Computing essentials 2013 (making IT work for you) written by Timothy J. O’Leary and Linda I. O’Leary.
- Pictures from Google Image
- Lecturer’s Slide